
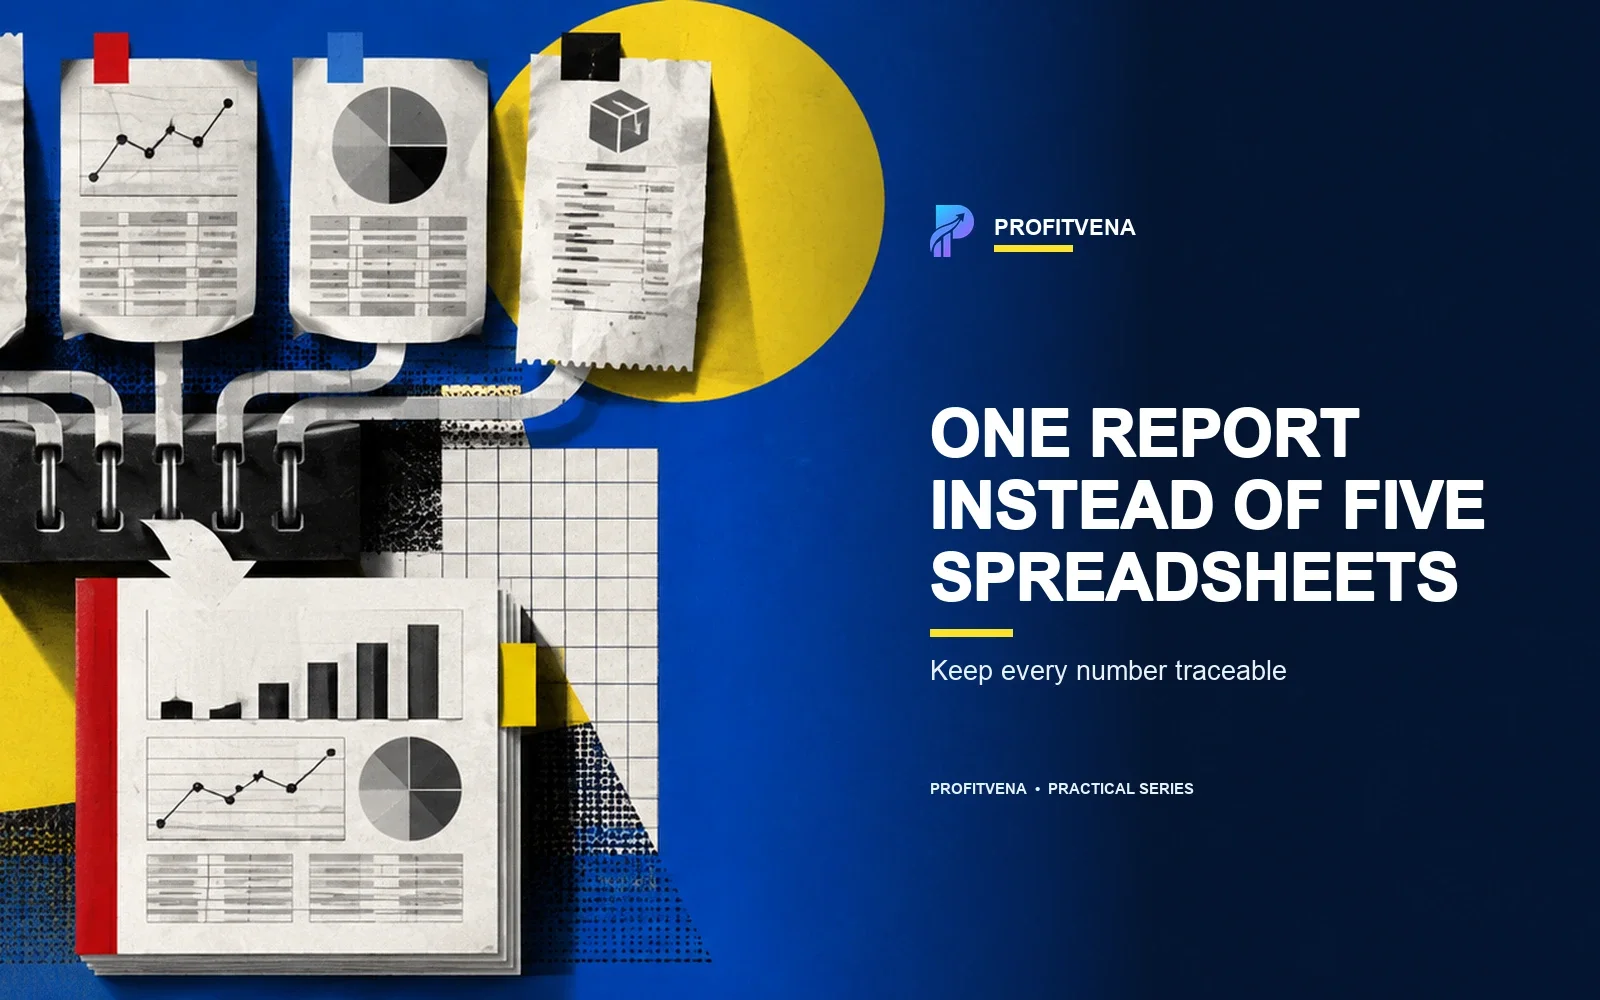
Combining exports into one table is easy. Making the result auditable is difficult.
One file may describe an order line, another a product and a third a financial operation. Dates, signs and identifiers have different meanings. Copying columns into a master spreadsheet can produce an attractive summary while destroying the path back to evidence.
A reliable report has three layers: source data → normalized operations → management summary.
Step 1: Define the decision
State which decision the report supports. Profit requires sales, returns, services, advertising and product cost. Payout reconciliation requires accruals, deductions and bank data. Inventory requires product, warehouse, status and snapshot time.
Do not force every business question into one row. Each dataset needs a declared grain: the smallest unit represented by a record.
Step 2: Preserve the source layer
Keep every export unchanged and record its source, seller account, filename or load batch, period, retrieval time, schema version, row count and control total.
The source layer is evidence. When a result changes, the team should reach a specific source row rather than an unidentified spreadsheet copy.
Step 3: Create a field map
| Common field | Possible source values | Rule |
|---|---|---|
| product_id | SKU, vendor code, marketplace item ID | retain all IDs and choose a stable internal key |
| operation_type | sale, return, logistics, storage, fee | normalize through a controlled dictionary |
| event_at | order, sale, report or payout date | retain the date type with the value |
| amount | accrual or deduction | define the sign for every operation type |
| source_ref | order ID, report row, operation ID | preserve it through aggregation |
“Amount” without currency, operation type and sign is not an analytical field.
Step 4: Normalize without erasing lineage
A normalized row should contain the business fields and the technical trail:
source → account → file/batch → source row → transformation rule → normalized operation.
When one source record becomes several operations, retain the relationship. When a row is rejected, store the reason: unknown SKU, invalid date, missing currency or unsupported type.
Step 5: Separate dates and signs
Order, realization, report and payout dates may fall in different periods. Select the primary date for each summary without deleting the others.
Treat signs with the same discipline. Sales, returns, compensation and deductions need documented directions. Manually “fixing negatives” invites double counting.
Step 6: Build the management summary
Only after normalization should you calculate recognized revenue, returns and adjustments, marketplace fees, logistics, storage, advertising, product cost, profit, margin, accruals and payouts.
Summaries can group by period, product, warehouse or account. Every metric should open into normalized operations and then into source evidence.
Step 7: Perform three reconciliations
- Structural: does each row have a type, product, date and currency?
- Financial: do source and normalized control totals agree?
- Management: is the difference between accruals, payouts and calculated profit explained?
An unbalanced report may still be shown when the variance is visible and has a status. Hiding the difference is more dangerous than declaring incomplete coverage.
Example lineage
Consider a RUB 420 logistics deduction. The consolidated report should retain the account, source document, operation ID, product, warehouse, report date, sale date, normalized logistics type, −RUB 420 amount and mapping-rule version.
The dashboard can then open a logistics increase down to the operation. Without lineage, the team sees only a warning and cannot tell whether to fix a tariff, data mapping or process.
Applying the model in ProfitVena
ProfitVena currently has a confirmed live Wildberries workflow. Profit Engine and Product 360 connect financial results with products and source context. Coverage depends on connected sources and workspace configuration.
A unified live report for other marketplaces should not be treated as available until the relevant connections are confirmed. For those sources, this model describes preparation architecture and roadmap direction rather than an active synchronization claim.
Forecast Center is also preparing for integration and is available as a preview.
Technical part updated in ProfitVena.
ProfitVena is developed by Wicsora LLC and is part of the Wicsora ecosystem.
Methodology: A unified report across marketplaces.
Previous article: SKU Unit Economics in ProfitVena.
Next: the management reports a seller should review every week.