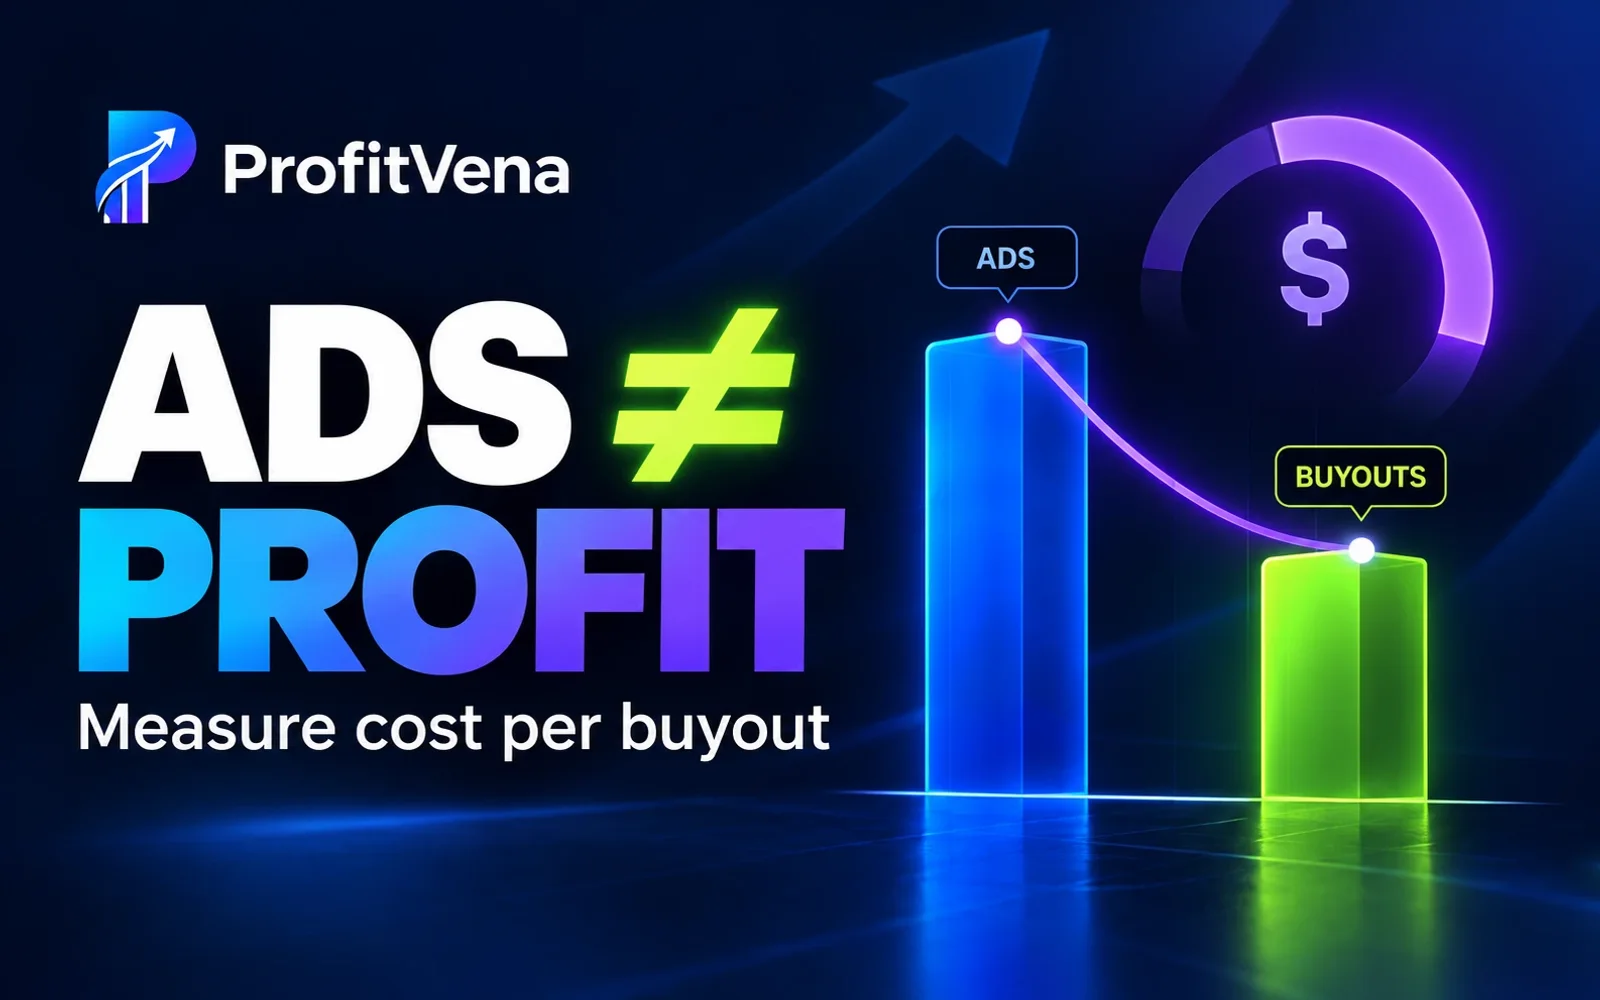
An ad dashboard shows clicks, orders and spend. A seller needs another answer: how much did one completed buyout cost, and was anything left as profit? An order, cancellation and buyout are different events.
Align the period first
Select the seller account, SKU or product group, campaign and dates. Reconcile ad spend with orders and confirmed buyouts. Avoid comparing this week’s spend with last month’s buyouts: the lag between order and completion makes that misleading. If buyout data is not complete, mark the metric provisional.
Calculate cost per buyout
The basic formula is ad spend ÷ confirmed bought-out units. For example, ₽12,000 of spend and 80 units bought out means ₽150 per unit. If the same spend produced 120 orders, cost per order is ₽100. That is a different metric. Neither number alone proves profitability.
Compare ₽150 with margin after marketplace fees, logistics, product cost, returns and other known expenses. If pre-ad margin is ₽220, the provisional remainder is ₽70 per buyout. These are teaching numbers, not marketplace tariffs or a real seller result. Mapping one campaign to one SKU may be incomplete; for multi-product campaigns, specify an allocation rule and label the output an estimate.
Three checks before changing bids
- Confirm that spend and buyouts cover the same seller account, SKUs and comparable dates.
- Check cancellations, returns and later charges. Mark an unfinished period provisional.
- Compare cost per buyout with available margin and your ad budget limit. Verify sources before changing bids.
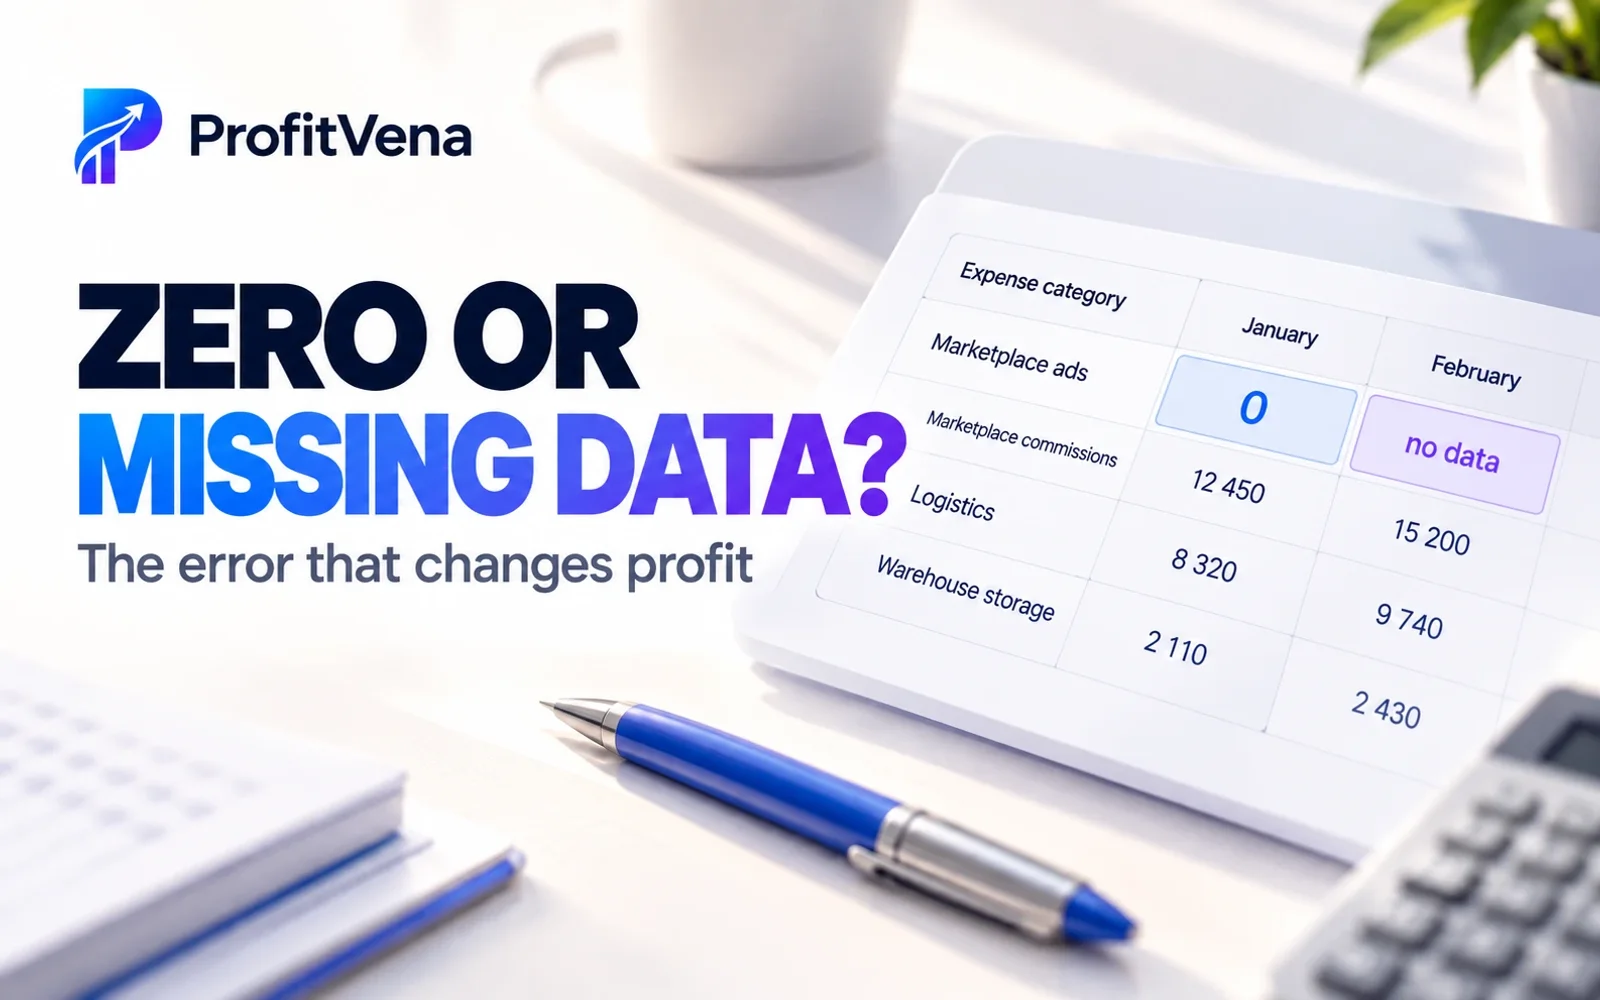
A zero ad expense also needs verification. See Zero or Missing Data? Check SKU Profit.
ProfitVena supports analysis of available Wildberries data and supported Excel/CSV imports, SKU economics and source freshness. Completeness depends on uploaded expenses, product matching and configured product cost; this article does not assume exact automatic ad attribution across every SKU. The technical part was updated in ProfitVena. It is part of the Виксора ecosystem.